Tags
benefits, blue-collar workers, Bureau of Labor Statistics, compensation, managers, minimum wage, professionals, salaries, The Economist, wages, White-collar workers, {What's Left of) Our Economy
That was some claim made by The Economist earlier this month about blue-collar wages in America: They “have begun to rocket. In the year to the third quarter, wage and salary growth for the likes of factory workers, builders and drivers easily outstripped that for professionals and managers.” Even better, these workers, whose pay stagnation has practically defined the so far weak U.S. economic recovery from the Great Recession, have been enjoying pace-setting compensation gains for the last five years, the magazine writes.
I’d be feeling awfully good about this development – except the article in question was a model of overly enthusiastic cheerleading. More specifically, it’s a great example of how failing to look at statistics in enough detail can produce seriously flawed pictures of the economy.
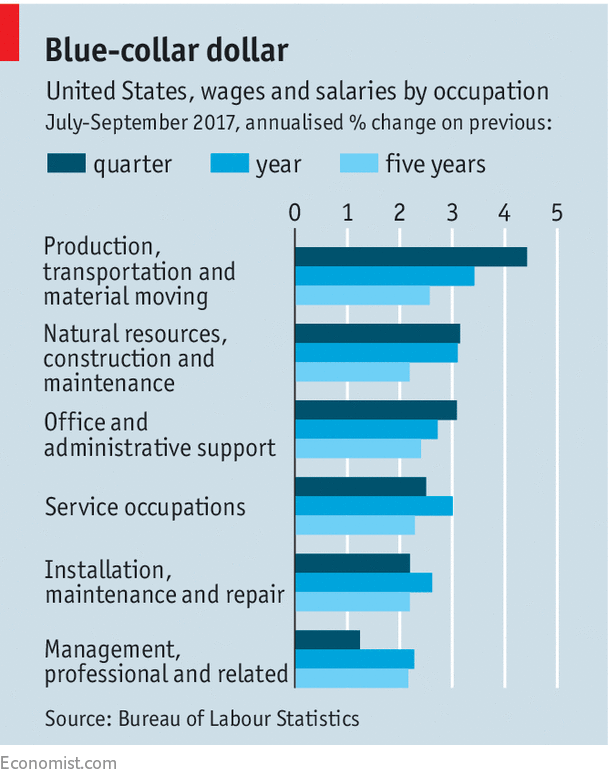
The heart of The Economist‘s case is this chart, which shows that overall compensation (wages, salaries, and benefits) for occupations that don’t involve managerial, executive, or high level administrative responsibilities, and that lie outside the professions, has been rising faster than compensation for occupations that do deal with these matters.
But even a glance should reveal a serious potential problem – the categories are awfully broad. In fact, they lump together lots of occupations that on their own seem awfully big. (To be sure, the source – the Bureau of Labor Statistics – uses these categories. But it presents narrower ones, too.] Further, the five-year period The Economist uses as its longest-run time frame is a period that’s economically meaningless. And in fact, disaggregating those occupational categories and using an economically meaningful long-term time frame (the duration of the current recovery) yields significantly different results.
For example, according to the chart, the big American compensation winner has been the “production, transportation, and material moving” cluster. Adjusted for inflation (which the magazine doesn’t do), here’s how its compensation (including for government workers in these occupations) has improved over the latest quarter year for which data are available, the latest year for which we have statistics, and since the recovery began:
2Q 2017-3Q 2017: +0.38 percent
3Q 2016-3Q2017: +1.06 percent
current recovery: +5.56 percent
This performance is indeed much better than the super-category covering white-collar workers – “management, professional, and related” workers:
2Q 2017-3Q 2017: -0.01 percent
3Q 2016-3Q 2017: +0.01 percent
current recovery: +2.86 percent
But look what happens when you separate production workers from the transportation and material moving workforce:
2Q 2017-3Q 2017: +0.49 percent
3Q 2016-3Q 2017: +0.79 percent
current recovery: +4.58 percent
The compensation gains are still better than those for the managers. But the gap is a good deal smaller.
Now let’s remove professional workers from the management cluster. The compensation increases for business and financial managers are:
2Q 2017-3Q 2017: -0.01 percent
3Q 2016-3Q 2017: +0.57 percent
current recovery: +4.48 percent
Except for the latest quarterly figure, they’re pretty comparable to the advances for the production workers.
Now let’s look at another blue-collar category – “office and administrative support.” Compensation increases for the relevant time frames are as follows:
2Q 2017-3Q 2017: -0.009 percent
3Q 2016-3Q 2017: +0.19 percent
current recovery: +4.63 percent
These increases over the short-term are actually somewhat weaker than for the business and financial managers. When it comes to “installation, maintenance, and repair,” the latest quarterly compensation gains were a bit better than those for the business and financial managers. But the latest yearly and recovery era increases for the installation category were worse than those for the business and financial managers.
2Q 2017-3Q 2017: +0.01 percent
3Q 2016-3Q 2017: +0.39 percent
current recovery: +4.40 percent
And we see the same kinds of numbers for the catch-all “service operations” category:
2Q17-3Q17: -0.01 percent
3Q16-3Q17: +0.38 percent
current recovery: +3.04 percent
So what’s really going on here is that compensation for some blue-collar workers has recently begun to rise faster than compensation for some white-collar workers, and that compensation for some white-collar workers continues to rise faster than compensation for some blue-collar workers. And let’s not forget how governments across the country have acted in the last few years to juice blue-collar pay – by raising the minimum wage. These actions, whatever their substantive merits or flaws, tell us nothing about underlying trends shaping the economy.
Yes, it’s hard to turn those observations into a catchy headline and an eye-opening story. But that’s why discerning readers have learned to distinguish journalism from clickbait.
