Tags
Andrew R. Morral, crime, Giffords Law Center to Prevent Gun Violence, gun control, gun violence, homicides, Im-Politic, mass shootings, RAND Corporation, school shootings, The Globe and Mail
Mysteries continue to abound about mass shootings like the recent atrocities in Buffalo, New York and Uvalde, Texas. Chiefly, as I’ve previously noted, for most of its history, the United States was even more awash with guns than today. Yet Buffalo- and Uvalde-type shootings — the kinds of gun violence perpetrated by individuals against innocents completely unknown to them – are very recent phenomena.
Yesterday, thanks to my friend, the political commentator Mickey Kaus, I came across several more, in the form of a graphics feature from the Canadian daily, The Globe and Mail, and especially, the combined, and deeply confusing, story that seems to be told by charts four and five (below).
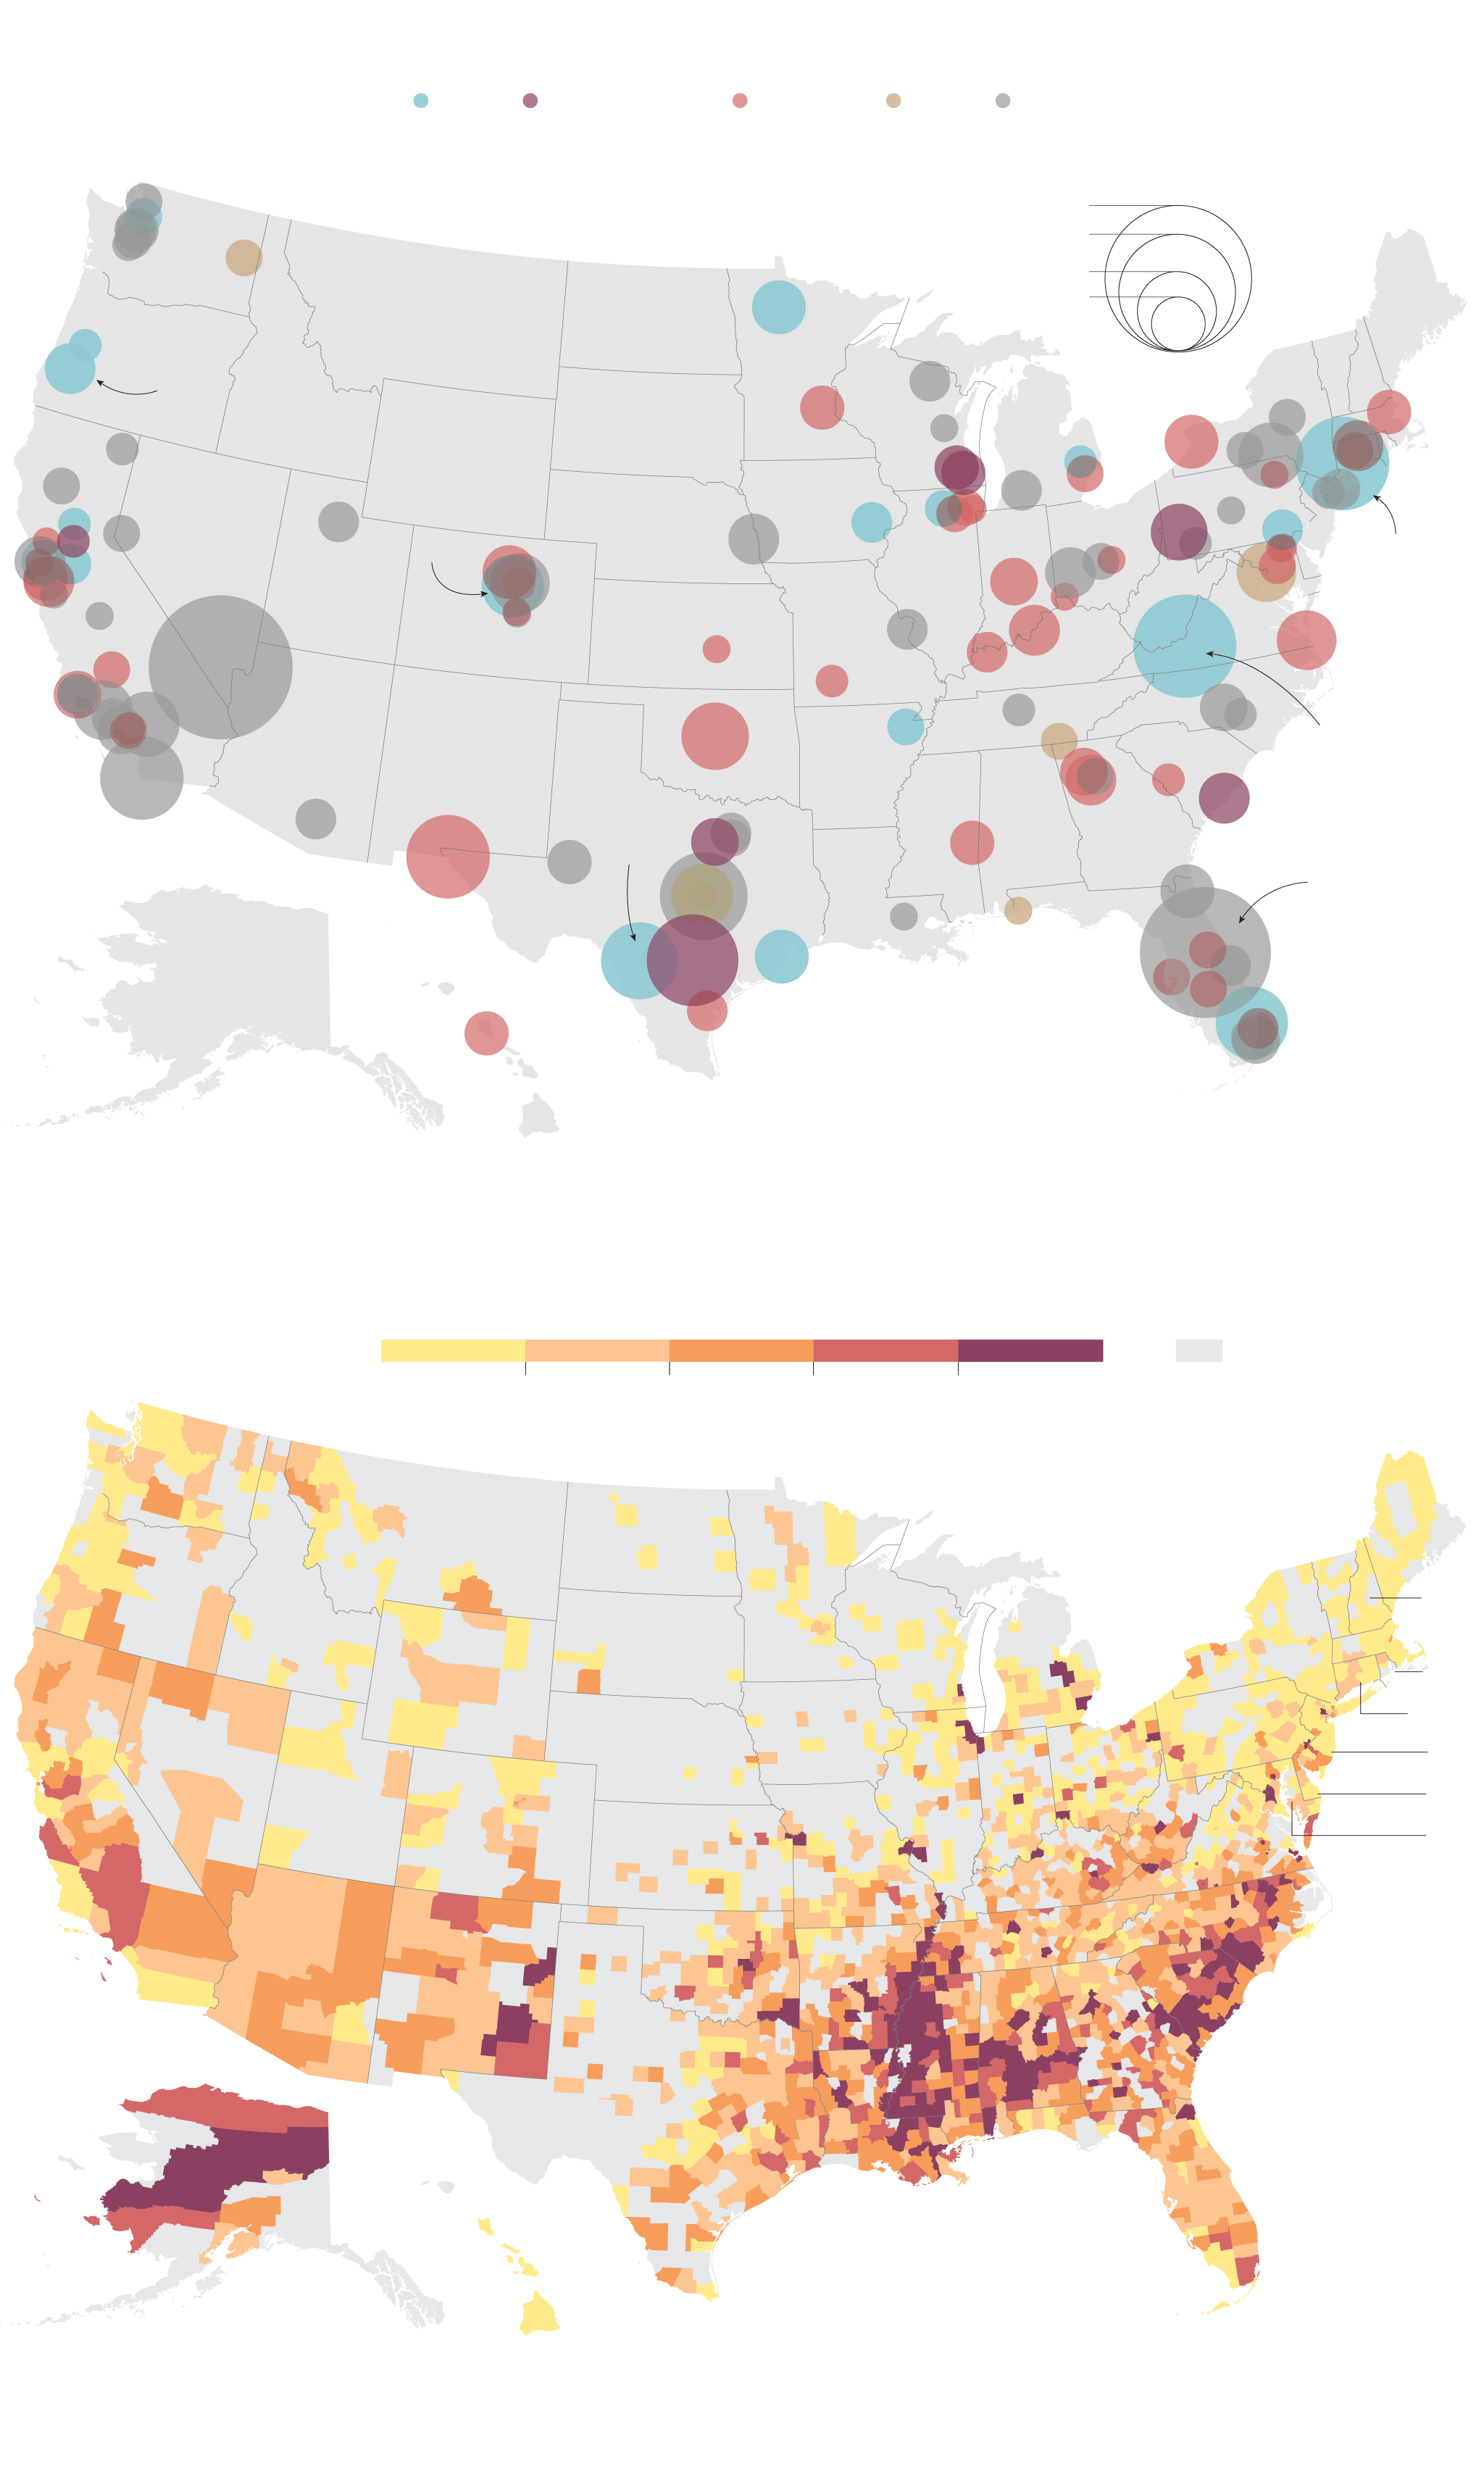
Let’s start with the chart on the bottom, chart five, which shows U.S. “Firearm-related homicides per 100,000 people, by county (2001–2020).” Unfortunately, the individual state names don’t show up on this reproduction, but as the original makes clear, the swathes of the country with by far the most gun-related homicides are Alaska, Mississippi, Louisiana, Alabama, and North and South Carolina. They’re the states with the biggest concentrations of dark brown counties (which signify the areas with the highest rates of such gun violence), along with big cities like Washington, D.C., Baltimore, Detroit, and Chicago, which show up as little dark brown dots.
Moreover, according to the Giffords Law Center to Prevent Gun Violence, which is an ardent supporter of stronger gun control laws, the states mentioned above have all earned failing grades in terms of gun control measures – except for North Carolina, which merited a “C.”
So it’s easy to conclude that the above states are those where it’s easiest to get a gun – and where guns’ prevalence is most dangerous because they’re also logically the states with the biggest relative numbers of residents likely to use these weapons with deadly results.
Now, however, look at chart four, which illustrates “Deaths in mass shootings since 1982, by location [and] type.” The bigger the circle, the higher the numbers of fatalities that have resulted from each of these incidents. And what I see is that, with the (possible) exception of the Carolinas, those states with the highest levels of firearms homicides adjusted for population have suffered scarcely any mass shootings of any kind, and only one mass school shooting (depicted with grayish-blue circles) – in Arkansas.
Viewed from the opposite perspective, look at the states with the biggest concentrations of mass shootings of all types. They look very much like California, Texas, Florida, and New York. Just behind them are New York, Colorado, and Georgia, along with the D.C. area and the Chicago area.
Yet going back to the homicide chart, you can see that California, Texas, Florida, Colorado, and New York seem pretty tranquil on this front, with Georgia standing as an exception. (It’s true that Texas contains big areas of gray, where no data is supposedly available. But can anyone reasonably doubt that if these regions were homicide-heavy, we would know about it?)
Even more puzzling: The Gifford Center awards an “A” on gun control laws to California, Colorado, and New York, a “C” to Florida, and the aforementioned “F” to Texas.
These and other ongoing mysteries and paradoxes further convince me of the argument most recently advanced by Andrew R. Morral, who heads the Gun Policy in America research project at the RAND Corporation, a leading think tank: that “although some laws that reduce gun violence in general may also reduce mass shooting” (for example, restrictions on magazine capacity) “It’s an unfortunate fact that mass shootings are sufficiently rare that it is hard to establish with scientific rigor whether policies affect them….”
